
Market · News & analysis
EU electric-car share reaches 22.7% as four markets lead the shift
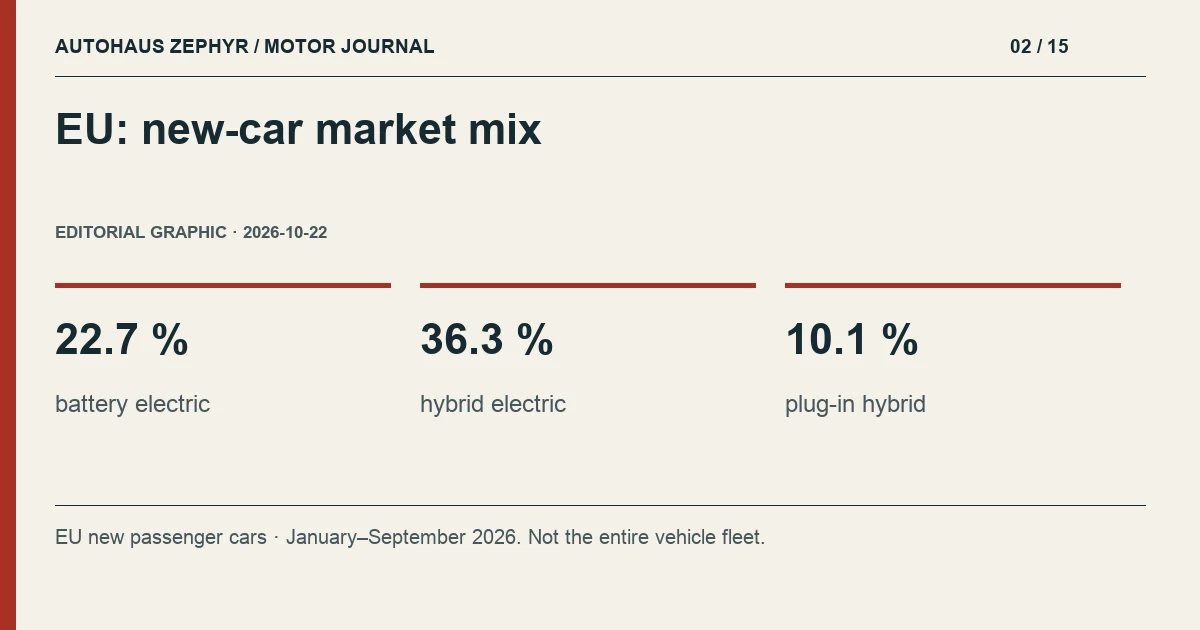
Battery-electric cars reached 22.7% of new EU registrations from January to September, up from 16.1% a year earlier. ACEA’s 22 October report shows an expanding overall market and a concentrated transition: France, Germany, Denmark and Belgium account for 64% of battery-electric registrations.
What matters
The 22.7% figure is an EU year-to-date market share, not a range figure, fleet share or buying recommendation.
What ACEA published this week
January–September 2026 registrations increased by 5.7%. Battery-electric cars accounted for 22.7% of the market, hybrid-electric cars for 36.3%, and plug-in hybrids for 10.1%. These are the categories and results in ACEA's release. They should not be combined using vague marketing labels or presented as figures for September alone.
A 6.6-point gain is different from 6.6% unit growth
Battery-electric share increased from 16.1% to 22.7% between the comparable 2025 and 2026 year-to-date periods. Subtraction gives a 6.6 percentage-point gain, an editorial calculation from ACEA’s figures. It is not percentage growth in registrations, which uses a different denominator. The association records 1,931,465 new battery-electric registrations over the nine months.
Electric cars are therefore gaining weight within a total market that is also expanding. However, these are additions to the new-car market over nine months. The 22.7% figure does not describe the share of all cars already on the road, nor establish an identical mix in every country or between household and business customers.
Four markets account for 64% of battery-electric registrations
France, Germany, Denmark and Belgium together accounted for 64% of battery-electric registrations in the period. Their year-on-year increases differed: 79.1%, 58.1%, 40.3% and 15.7%, respectively. This concentration is why a European headline needs national context: the aggregate can depend heavily on a few large or highly electrified markets.
The shift also extends beyond battery-electric cars. ACEA records 3,090,530 hybrid-electric and 860,257 plug-in hybrid registrations. Petrol and diesel together hold 28.2% of the market, compared with 36.9% a year earlier. These categories should not be merged as though their everyday operation were identical, and the shares quoted here are not an exhaustive breakdown adding up to one hundred.
What a prospective buyer can learn
The powertrain mix helps explain industrial supply and manufacturers' priorities. It does not establish which technology will cost a particular driver less. That depends on journeys, charging access, purchase price and the intended ownership period. The most popular vehicle type may still be a poor match for an unusual routine.
A buyer should first describe a normal week and less frequent long journeys. Alternatives can then be compared for equivalent space, equipment and ownership costs. Statistics help identify questions rather than replace a personal budget. They do not prove a future resale value either; that would require model-specific evidence from the used market.
Hybrid does not describe a single ownership pattern
The definitions in a statistical report should survive the journey into a vehicle comparison. A non-plug-in hybrid and a plug-in hybrid place different demands on charging infrastructure. A broad electrification label should not become an assumption about range, fuel use or urban access for every version.
The practical starting point is the precise variant and its technical documentation. Next come the conditions underlying each measurement. If two offers use different cycles, battery-capacity definitions or test criteria, some of the apparent performance difference may be a presentation difference. The size of their statistical categories cannot resolve that mismatch.
Build a comparison sheet instead of following a ranking
A personal worksheet can include annual distance, typical routes, charging access, insurance, maintenance and total purchase budget. Verified values should remain separate from estimates. Recalculate when an important assumption changes: favourable energy prices in one scenario do not establish a universal saving.
For an imported vehicle, compare the delivered cost and documentation of the actual car as well. New-car market statistics provide context, but do not calculate taxes, transport or the battery condition of a used example. These are different layers of evidence. Merging them turns an economic release into a promise its data never made.
Questions answered
Does this release describe September alone?
No. The highlighted figures cover January–September 2026.
Does EV market share prove that I should buy one?
No. Suitability depends on your journeys, charging arrangements and a model-specific ownership budget.
The latest release confirms a shifting powertrain mix. It becomes more useful when geography, dates and definitions remain intact. The buying decision follows that interpretation, using a specific vehicle, a stated routine and a genuinely comparable budget.
Sources & editorial policy
Written by Autohaus Zephyr from the linked sources. Manufacturer figures are attributed claims, not our own tests. The practical comparisons and clearly identified examples are editorial analysis. Market availability and specifications require confirmation for the exact car.
Corrections: info@autohauszephyr.ch
How we work →